FAFDrugs4

The concept of drug-likeness or compound quality provides useful guidelines for early-stage drug discovery and chemical biology endeavors. Simple combination of PC properties can be computed to investigate this notion of quality of molecules. Depending on the selected PC values, one may try to predict or estimate if a compound could be orally available or potentially problematic, soluble, stable.
Well-known examples applying sharp thresholds on several PC properties are the Lipinski's RO5 [13] or the Gleeson's RO4 [26]. By applying the concept of desirability, Bickerton et al [79] reported a new way to estimate compound quality called the quantitative estimate of drug-likeness. The computations involve eight descriptors (molecular weight (MW), octanol-water partition coefficient (logP), the number of H-bond donors and acceptors (HBAs and HBDs), the molecular polar surface area (PSA), the number of rotatable bonds (ROTBs), the number of aromatic rings (AROMs) and the number of detections for the 113 published structural alerts (ALERTs).
Then, each compound outputs a value (a score) ranging from zero (unfavorable) to one (favorable). As for FAF-Drugs4, the FAF-QED engine has been embedded in the RPBS' Mobyle Portal, it reads an SDF input file and outputs a csv file which provides the calculated descriptors, the related desirability functions and the QED estimations.
The benchmarking of our implementation, which uses the available FAF-Drugs4 architecture, was performed on a dataset built of 771 orally dosed approved drugs provided in the supplementary material of the seminal work of Bickerton et al.. This step is important as in the original QED method, the computations of some descriptors are performed with a commercial package while here, we used approaches that are free for academic scientists and for non-commercial users. Our results for MW, PSA, ROTBs and HBDs present a correlation of R2 > 0.99 with the published values, while we succeeded to reach a correlation of 0.98 and 0.94 for respectively HBAs and detection of ALERTSs by designing specific SMARTS that match as best as possible the substructures of the published studies. We scored a correlation R2= 0.90 for logP by applying XLOGP3 method [5] while the original approach uses AlogP (Ghose and Crippen, 1987) computations and a correlation R2= 0.94 for AROMs by using the cxcalc command line tool in Chemaxon JChem (version 16.6.13.0).
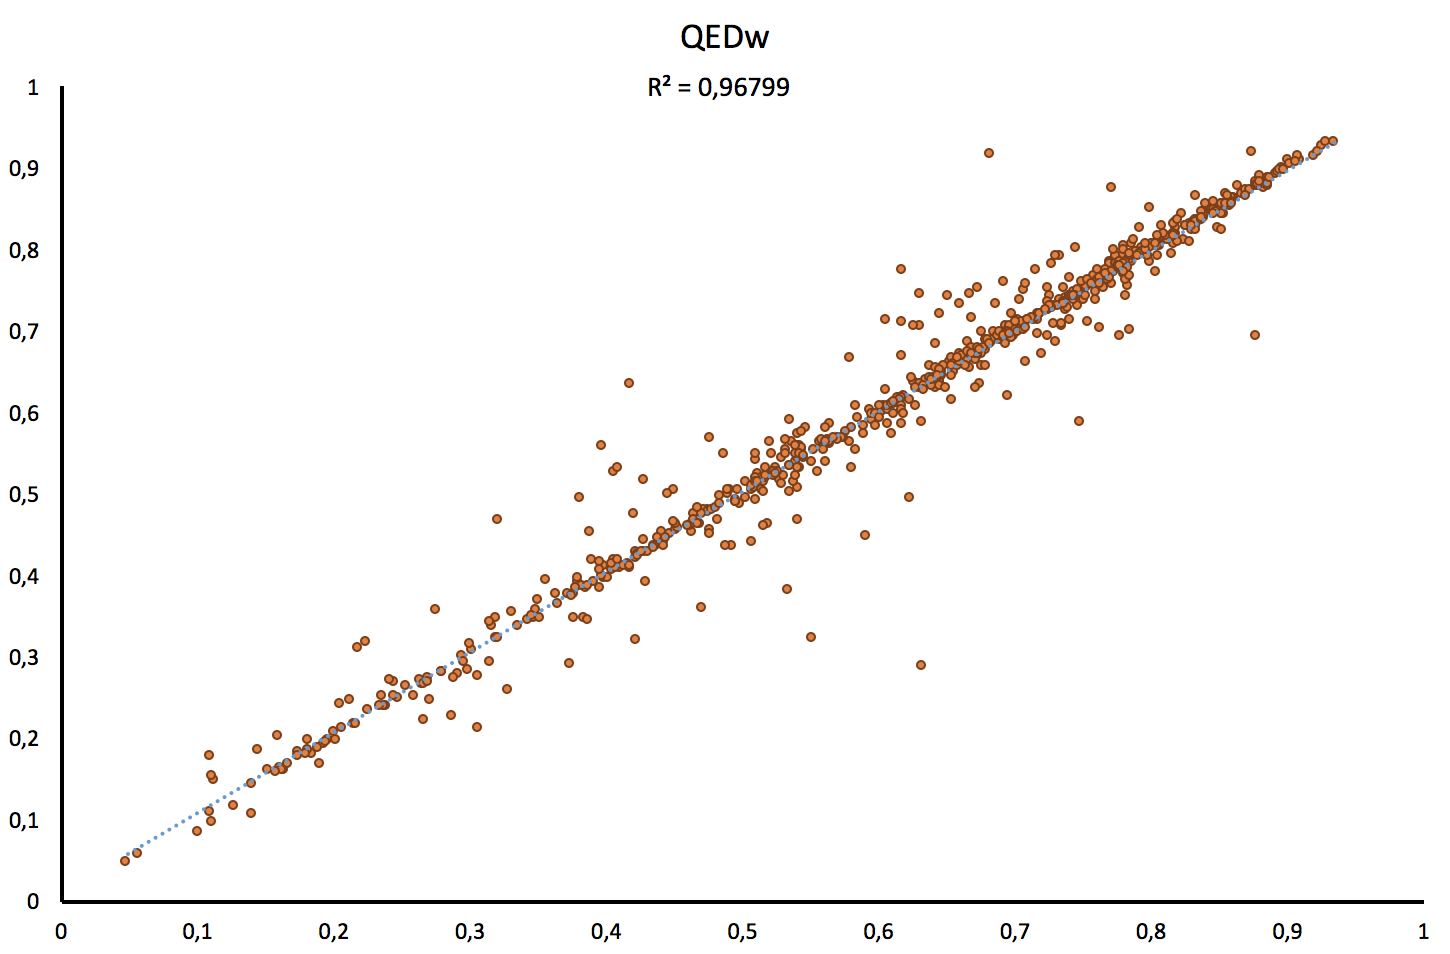
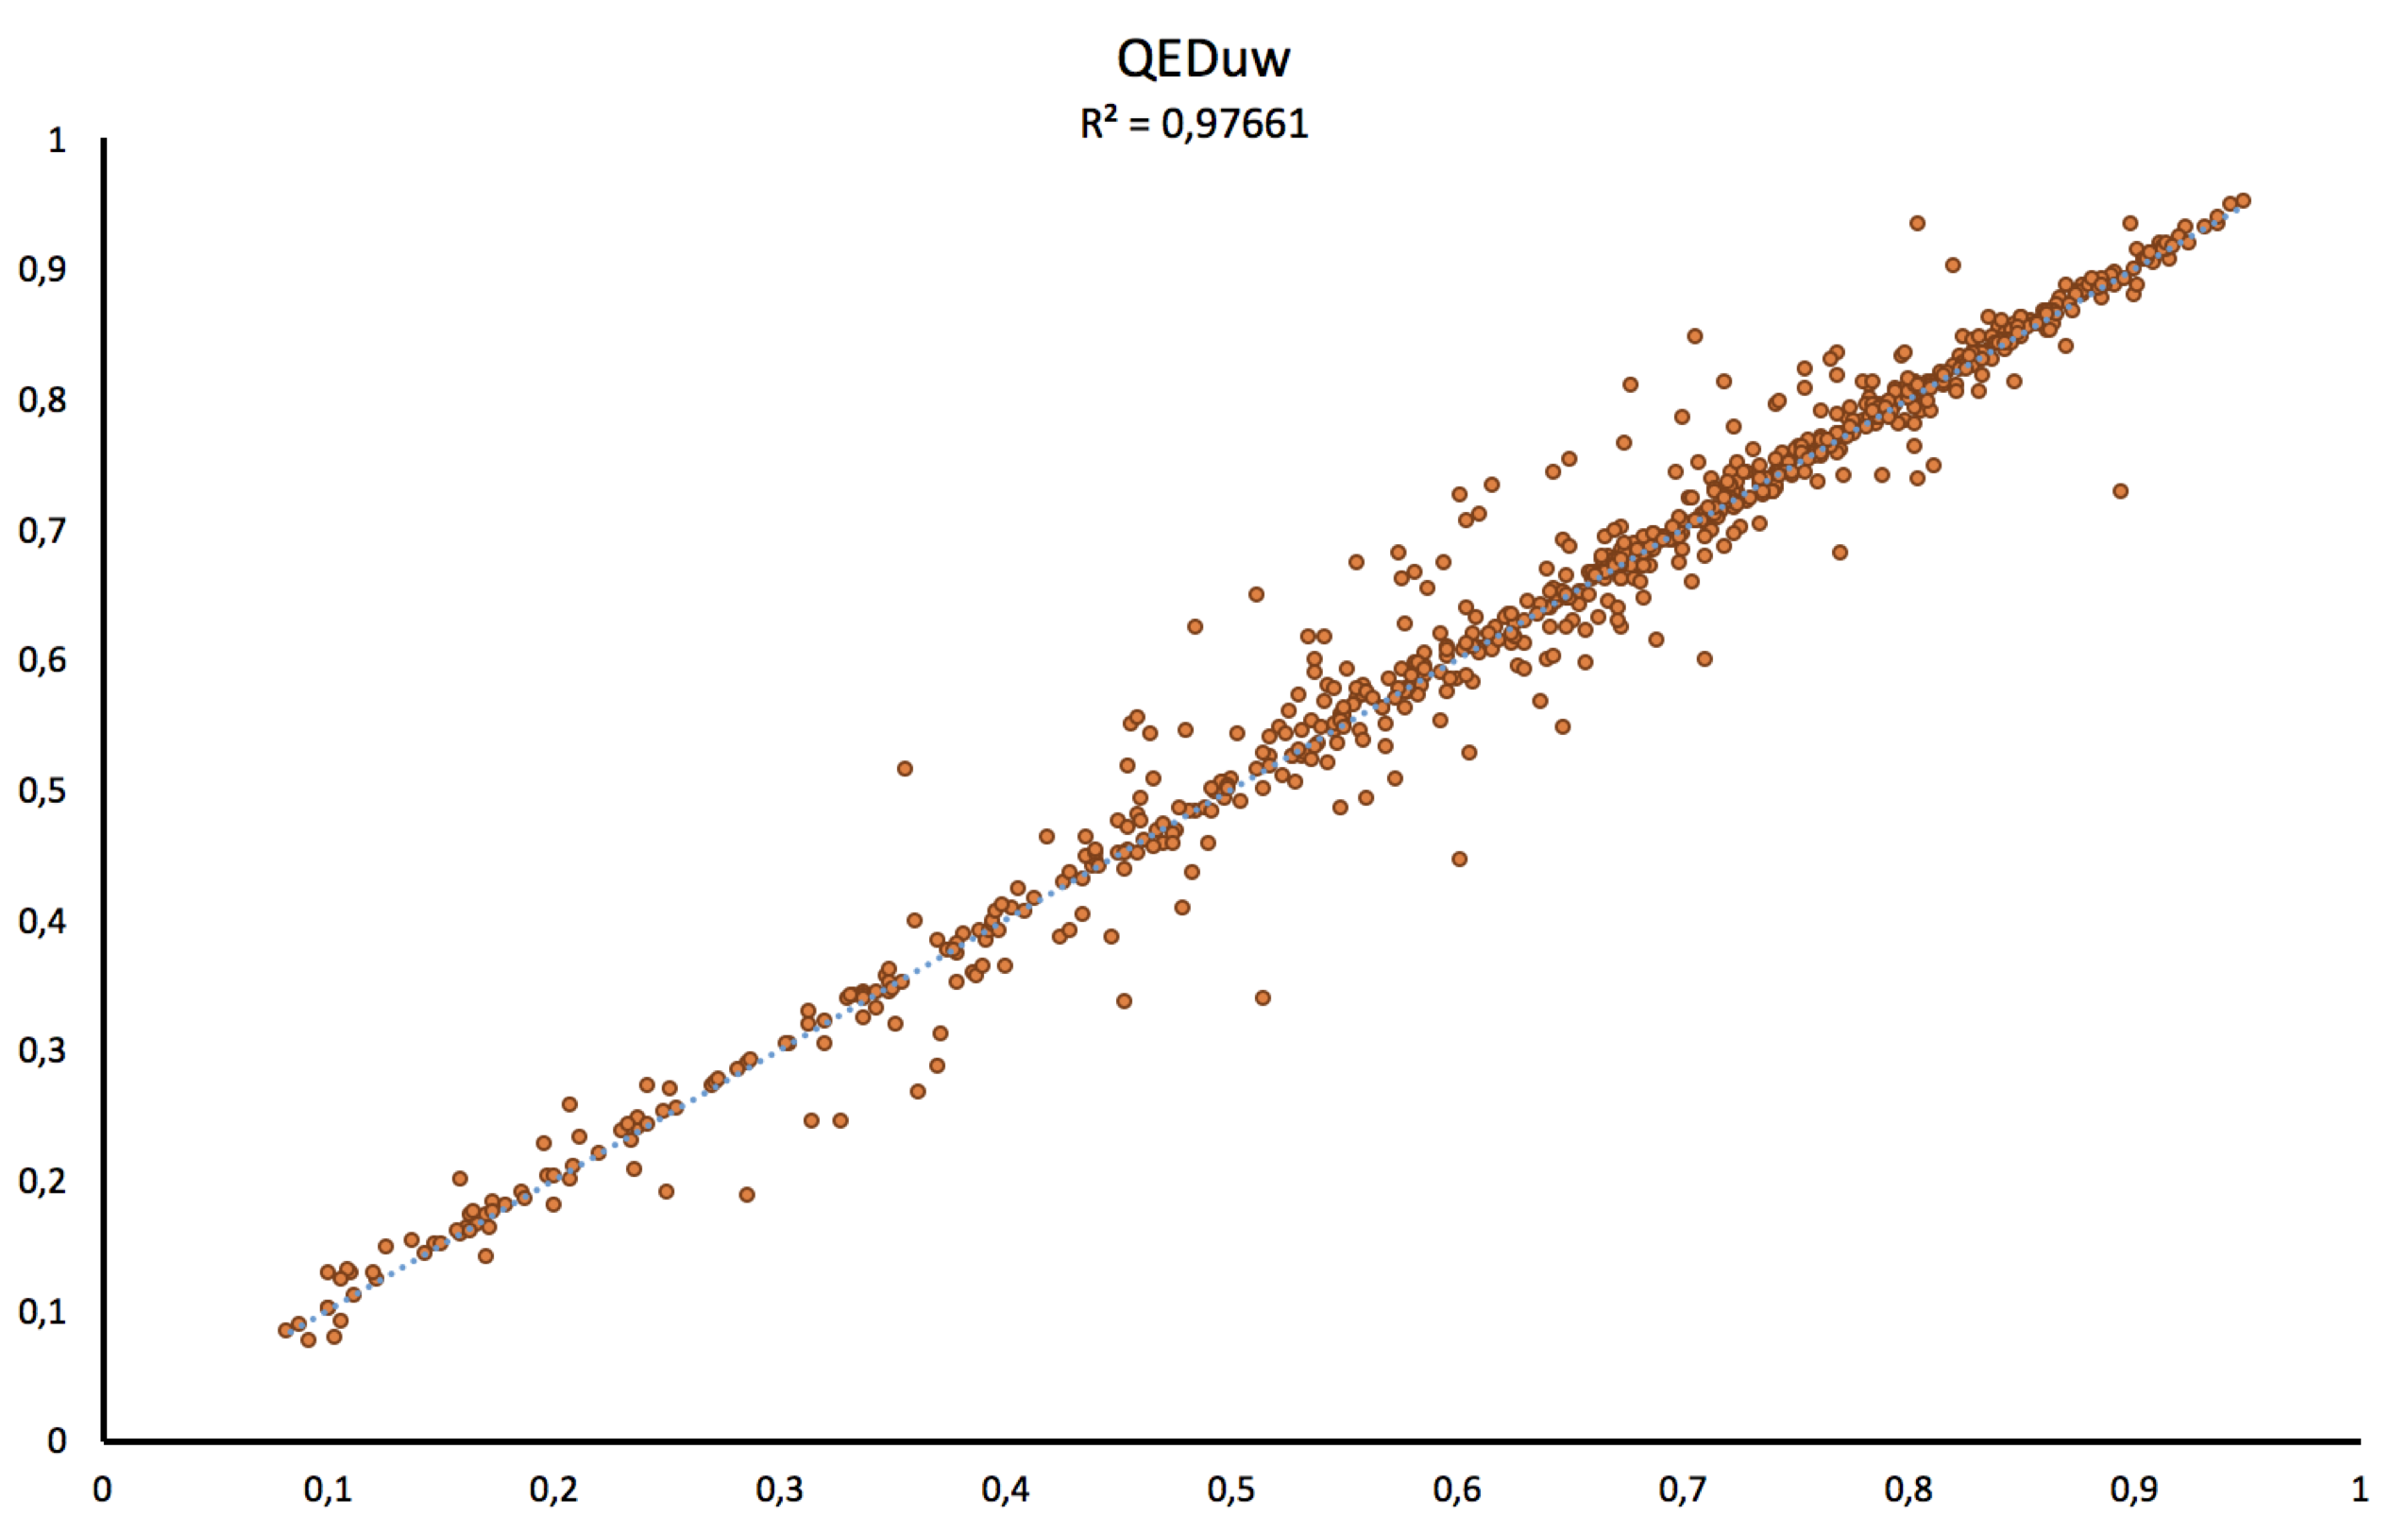
Thus, as shown on the figure below, our implementation scores good correlations for both, the weighted (w) and unweighted QED (uw) values with respectively R2= 0.97 and R2= 0.98.